The Kantor Demo-Tool and European Muslim Population
1.-The Kantor Demo-tool
The Kantor Demo-tool is an Excel spreadsheet designed to produce transparent and easy population projections for non-professional users. The vegetative dynamics of a population is strongly dependent on its age structure, because both birth and death rates are strongly age-dependent. A population pyramid is a graph showing the population in a given geographical area (vg. a country) in a given year. The Kantor Demo-tool is designed to project future population pyramids (stocks-by-age), using two flow (by age) curves: the mortality and fertility curves. For demographically open countries, a migration curve should be provided in addition.
The Demo-tool includes an Excel book (it is very big, and it should be saved, not opened) and a “Readme” word file explaining both elementary demographics and its implementation in Excel. The idea is to put on the hands of any Excel user an easy tool to build demographic projections. It can be used also for educational propourses. I suggest the reader to have a look into the 4-page readme of the demo-tool now, putting special attention in the treatment of fertility.
The Kantor demo-tool is an open-source piece of software, and can be modified and used as it pleases the reader. Quotation of the source, anyway, is encouraged.
2.-Exercice: Muslim Europe?
After 9/11 a ghost has been haunting Europe: the ghost of Islamic takeover. Mark Steyn, Daniel Pipes, Guillaume Faye, Oriana Fallaci and Bat Ye’or have been the highest profile intellectuals pointing out the sharp demographic decline and likely population replacement that Europe is about to suffer. The Internet has produced an additional pool of anti-islamists fearing the coming of an Islamic Europe (Eurabia): vg, Brussels Journal, Fjordman, Gates of Vienna and the Pajamas Media bloggers.
Natural population growth depending on fertility and mortality curves can be easily projected under different fertility scenarios. Migration flows under two scenarios are also projected.
The following hypotheses are done in all the scenarios:
1) Muslim and non-muslim populations are supposed totally separated, ignoring conversion and inter-marriage. In fact, this paper proves (for the Austrian case) the high level of separation between the two populations.
2) Fertility structure is given by the convex model (see Demo-tool readme)
3) The age structure of the European population in 2005 is extrapolated from the Netherlands. Also its mortality curve.
4) The European Muslim population in 2005 is supposed to be 8% of total; its age structure and fertility is extrapolated from the Algerian population (UN stats), whose fertility (of 2.38 children/woman) is taken as Muslim fertility in 2005.
5) The European non-muslim population is the 92% of total EU population of 463 millions (425 million aproxx); its fertility in 2005 was 1.52 children/woman (European Comission).
6) For migration flows, the Eurostat statistical Yearbook (pag.53) quantifies total net immigration in the EU-15 in 1.5 million/year (2002). We suppose that 400.000 immigrants are from the New EU countries (EU-10), leaving a net inflow into the EU of 1.1 million. Our hypothesis is that 60% of those immigrants are Muslim.
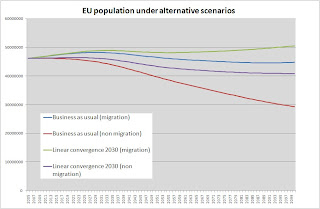
The three scenarios differ are about the fertility paths of both populations and the migration flows received.
1) Business as usual (with migration): fertility is locked in its 2005 levels (Muslim 2.38, non Muslim 1.52) for the whole century. Europe receives 1.5 million immigrants a year, 60% Muslims, for the rest of the century.
2) Business as usual (without migration): fertility is locked in its 2005 levels (Muslim 2.38, non Muslim 1.52) for the whole century. Migration is halted in 2005.
3) Linear convergence 2030 (with migration): Fertility moves linearly for both populations, converging to 2 children per woman in 2030. Europe receives 1.5 million immigrants a year, 60% Muslims, for the rest of the century.
4) Linear convergence 2030 (without migration): Fertility moves linearly for both populations, converging to 2 children per woman in 2030. Migration is halted in 2005.
The first graph displays the Muslim population as a percentage of total EU population. It shows that Muslim population would be around 15% in mid-century if migration flows were halted. If the present level of immigration continues, the Muslim population will be around 20%.

The following graph shows the path of the total EU population (Muslim and non-Muslim); the natural growth of European population will be very negative under all paths, and specially under the “business as usual-no migration” scenario. Still, even under this worst-case scenario the population in the 18-65 bracket would stabilize around the 60%.
For the European case [1], we can safely say that if migration is halted, the EU will not be Muslim by 2050. On the other hand, if fertility gaps are sustained over the century, we will see a substantial or catastrosphic population replacement. A strong anti-migrationist policy will guarantee a non-Muslim Europe in mid century, providing time for fertility and social adjustment to the feminist experiment. We are in our own hands.
PS. Meme. Many bloggers have shown a deep interest for the population/migrations dynamics in general and population replacement in Europe in particular . With the demo-tool all of them, providing fertility and migration can build their own population projections. Improvements in the Excel spreadsheets are also welcome. Consequently I will encourage the following bloggers to try their own demographic scenarios using the Demo-tool:
The Lorem-Ipsum Club, Wonka , Huber, Daniel Rodríguez Herrera, Reflexiones Iracundas, La Ilustración Evolucionista, Barcepundit, Debate 21, Holocausto Demográfico, and the anti-jihadist bloggers: in particular Lady Vorzheva, Noticias de Eurabia, La jihad en Eurabia, and Nueva Europa.
[1] The reader should remember the high concentration of Muslim population in a few countries and in some urban areas: in order to make national projections, the reader is encouraged to do national estimates with the relevant national data.
[2] Percentage of Muslim population in the 20-50 bracket (military age) was also estimated, but the difference with the full population composition was not relevant.
